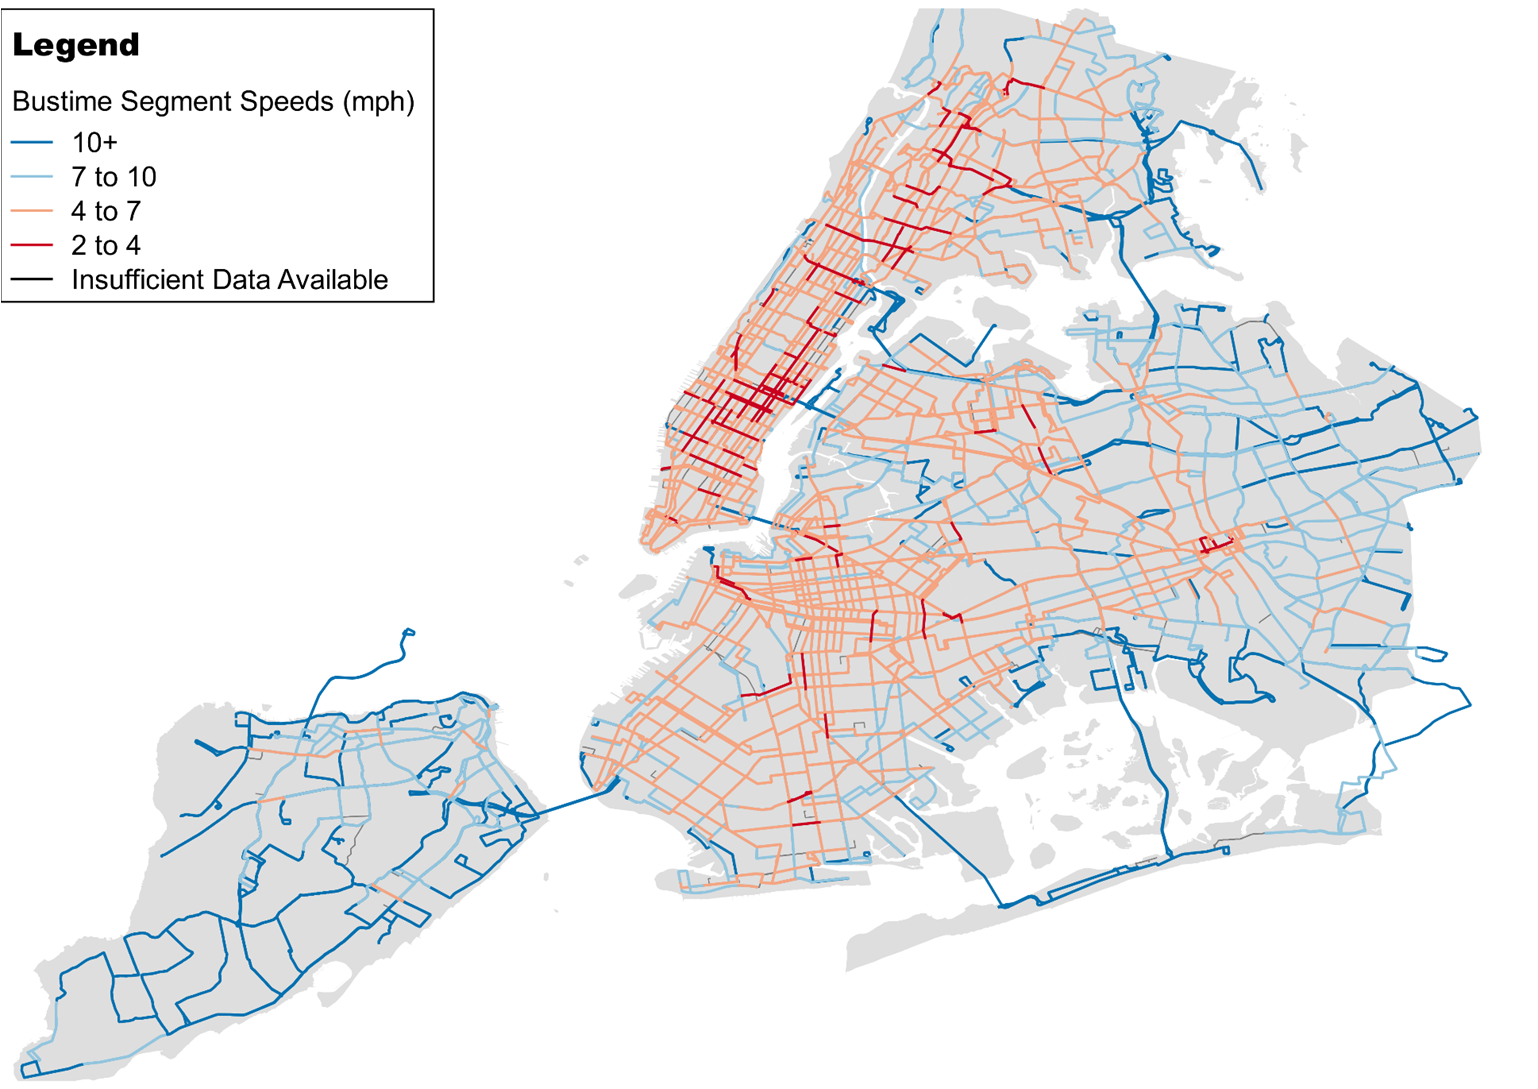
We utilized bus running time data from GPS-based automated vehicle locator systems to identify locations where average bus speeds were the lowest in regular service. The average bus speeds in general on this public transport system were trending downward, but the understanding of the reasons behind the delays were anecdotal prior to our data analysis effort. For individual routes, speed declines can be much more pronounced. This was a significant problem as slower bus speeds decrease route performance (financially and schedule wise), worsen service reliability, and cost additional crew resources. Our analysis using geographic information system (GIS) tools revealed that very low bus speeds were concentrated on specific route segments where traffic priority measures, service changes (e.g. introducing limited stop service), or rerouting could result major improvements to bus speeds across multiple routes.