A large transit agency’s cost of operations per passenger, per hour, and per mile was discerned to be very high. It sought to explore how practices differed from other operators. Understanding how one’s own system performs against similar peer properties is valuable in deciding on changes in transit network operations and management.
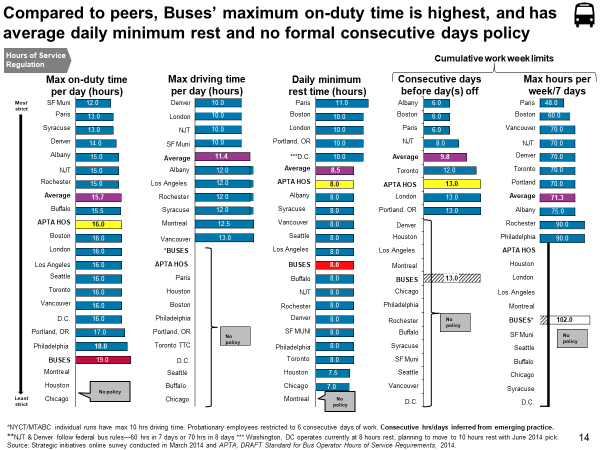
We were responsible for a program of domestic performance benchmarking. The program tracked operational indicators over the years such as cost of operation, vehicle breakdowns, average speeds, and differences in driver hours of operation among bus systems. Some of these operational statistics were not available from the National Transit Database and therefore had to be painstakingly collected and collated by contacting transit agencies one at a time, which were invaluable in identifying areas that require management attention and/or improvement programs.
Our analyses not only provided comparison data but additional context for interpreting the data, in particular differences in wage rates, collective bargaining agreements, training, fleet age and composition that accounted for cost differences. Through our benchmarking program, the operator was able to identify its own operational weaknesses and rectify both short-term and longer-term issues.