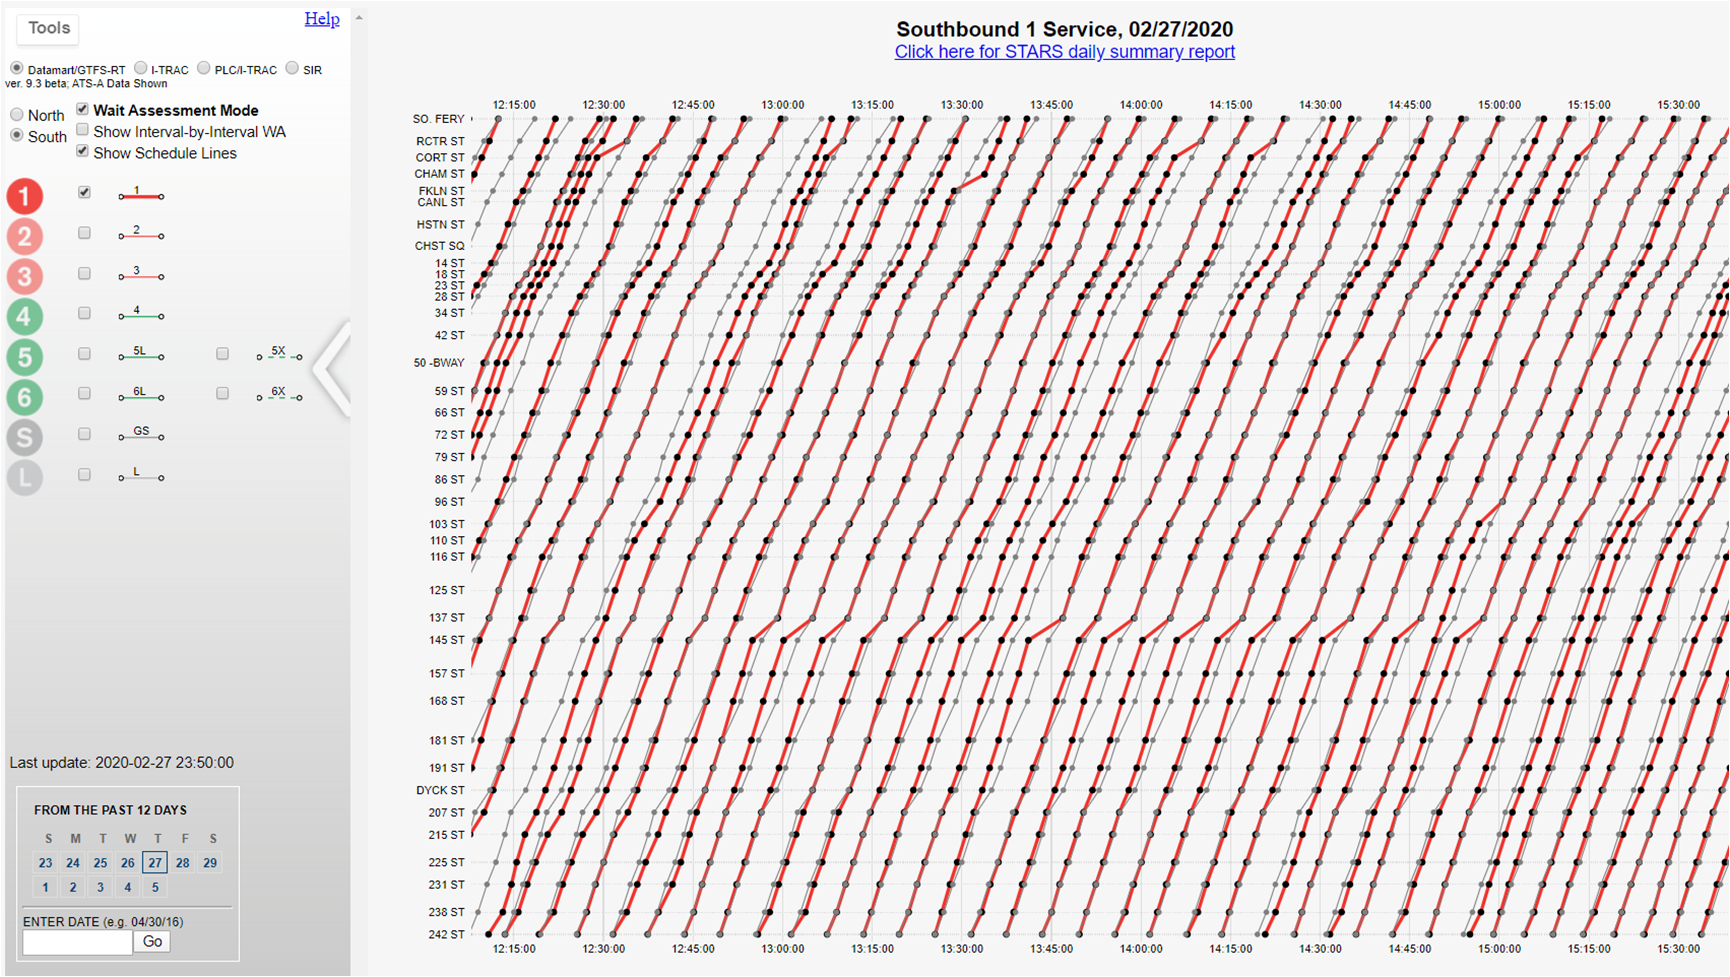
The NYCT subway punctuality is a key performance measure for the Operational Planning department. The traditional schedule timesheet and manual “punch in” method can’t meet the requirement of quick reaction upon the unexpected train delay. Mr. Reddy and his team developed the real-time Time-Space diagrams to mitigate this situation. The automated chart below plots location of individual subway trips over time on the horizontal axis versus location on the vertical axis. If headways on a subway line are even, the lines should be parallel and evenly spaced. This visual tool allows service supervisors to assess at a glance the quality of service being provided along an entire line. Any headway perturbations can be readily identified and corrective action promptly taken. These charts can be utilized for real-time service management or in post-mortem incident management critiques to assess what went well and what requires improvement next time.